|
|
hace 1 año | |
|---|---|---|
| .. | ||
| docs | hace 1 año | |
| kie | hace 1 año | |
| layout | hace 1 año | |
| pdf2word | hace 1 año | |
| recovery | hace 1 año | |
| table | hace 1 año | |
| README.md | hace 1 año | |
| README_ch.md | hace 1 año | |
| __init__.py | hace 1 año | |
| predict_system.py | hace 1 año | |
| utility.py | hace 1 año | |
README.md
English | 简体中文
PP-Structure
1. Introduction
PP-Structure is an intelligent document analysis system developed by the PaddleOCR team, which aims to help developers better complete tasks related to document understanding such as layout analysis and table recognition.
The pipeline of PP-StructureV2 system is shown below. The document image first passes through the image direction correction module to identify the direction of the entire image and complete the direction correction. Then, two tasks of layout information analysis and key information extraction can be completed.
- In the layout analysis task, the image first goes through the layout analysis model to divide the image into different areas such as text, table, and figure, and then analyze these areas separately. For example, the table area is sent to the form recognition module for structured recognition, and the text area is sent to the OCR engine for text recognition. Finally, the layout recovery module restores it to a word or pdf file with the same layout as the original image;
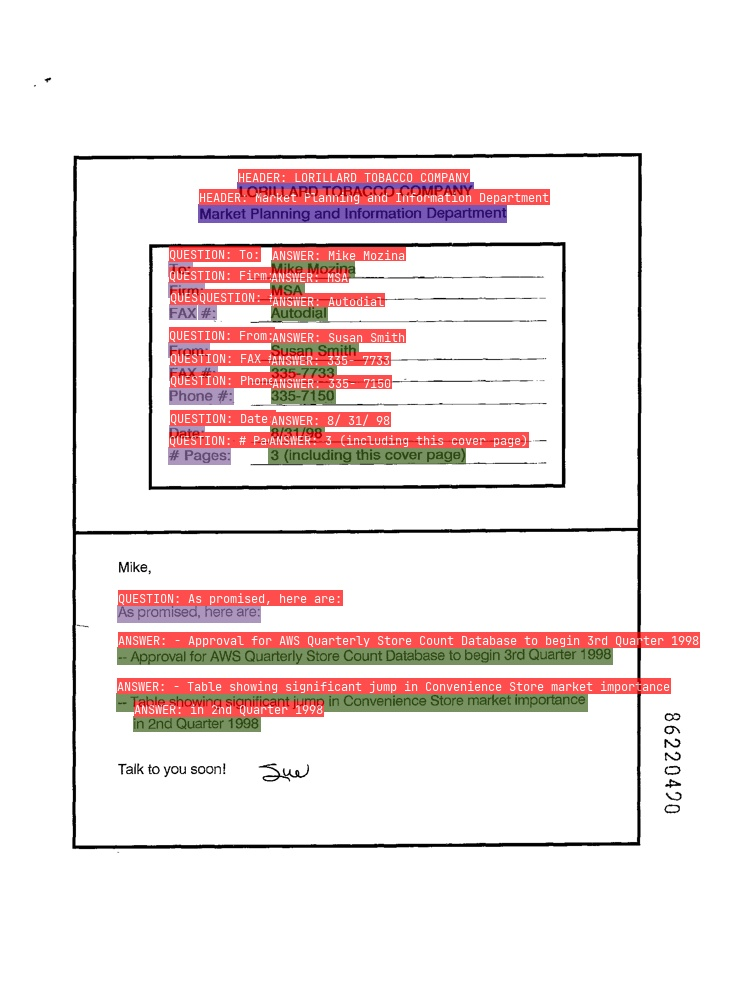
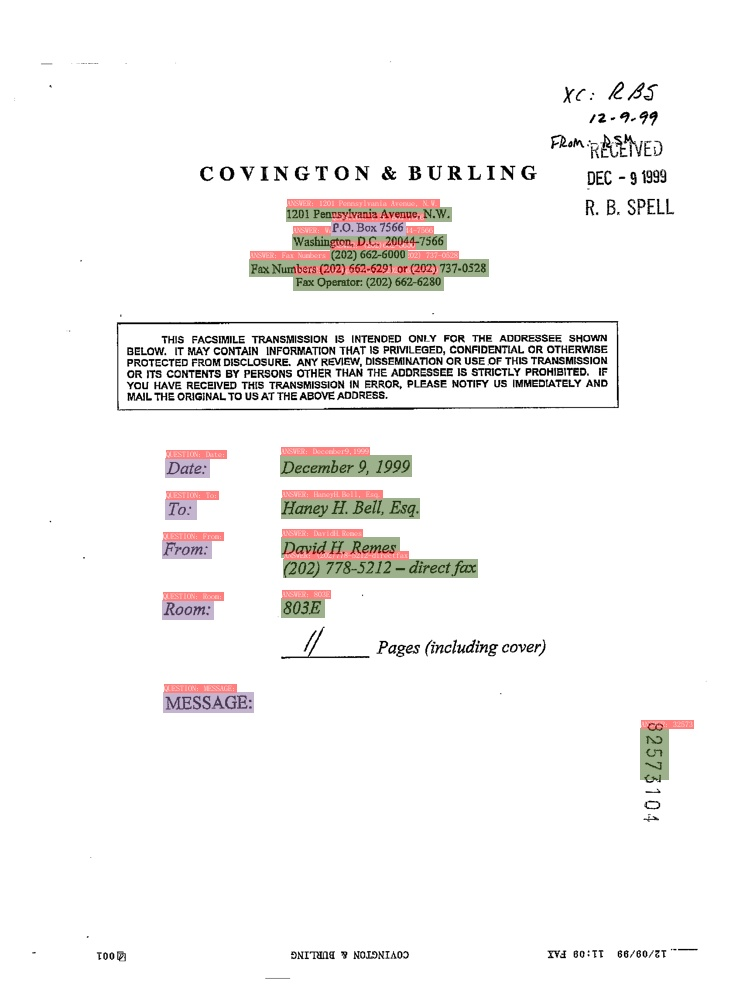
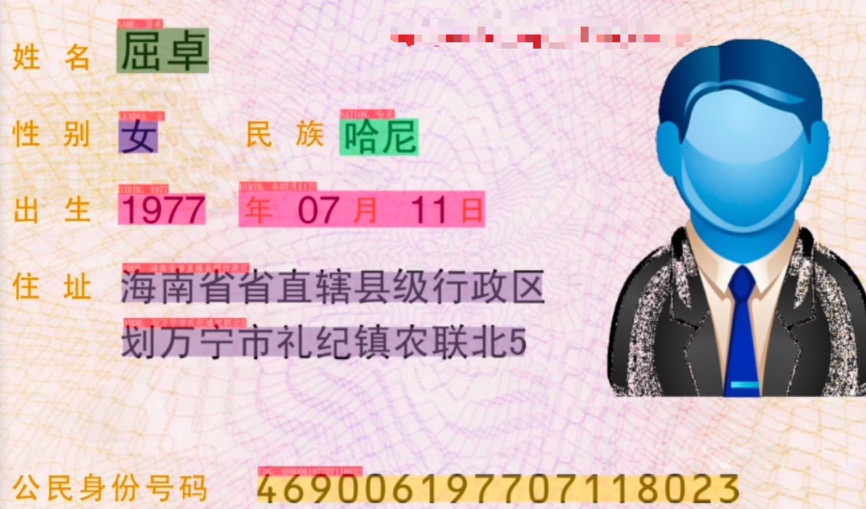
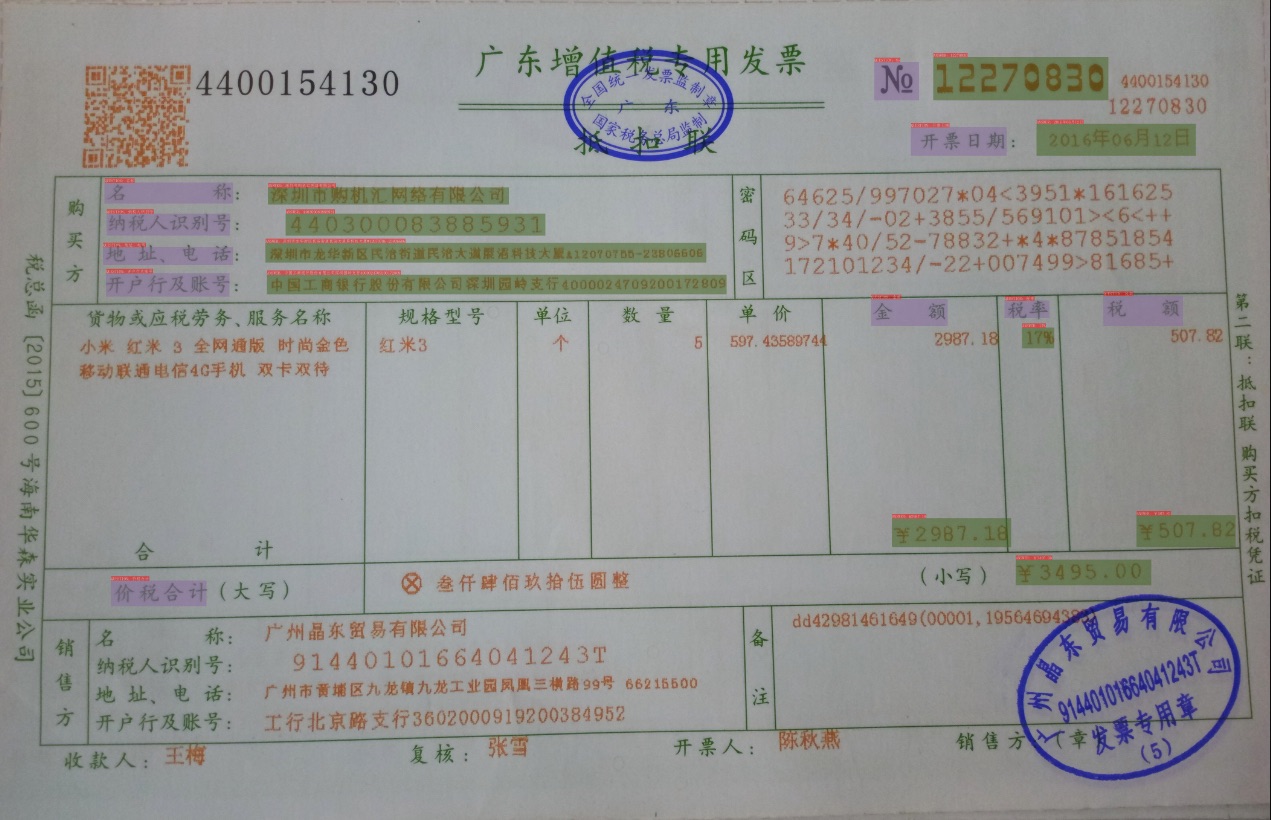
- In the key information extraction task, the OCR engine is first used to extract the text content, and then the SER(semantic entity recognition) module obtains the semantic entities in the image, and finally the RE(relationship extraction) module obtains the correspondence between the semantic entities, thereby extracting the required key information.

More technical details: 👉 PP-StructureV2 Technical Report
PP-StructureV2 supports independent use or flexible collocation of each module. For example, you can use layout analysis alone or table recognition alone. Click the corresponding link below to get the tutorial for each independent module:
2. Features
The main features of PP-StructureV2 are as follows:
- Support layout analysis of documents in the form of images/pdfs, which can be divided into areas such as text, titles, tables, figures, formulas, etc.;
- Support common Chinese and English table detection tasks;
- Support structured table recognition, and output the final result to Excel file;
- Support multimodal-based Key Information Extraction (KIE) tasks - Semantic Entity Recognition (SER) and **Relation Extraction (RE);
- Support layout recovery, that is, restore the document in word or pdf format with the same layout as the original image;
- Support customized training and multiple inference deployment methods such as python whl package quick start;
- Connect with the semi-automatic data labeling tool PPOCRLabel, which supports the labeling of layout analysis, table recognition, and SER.
3. Results
PP-StructureV2 supports the independent use or flexible collocation of each module. For example, layout analysis can be used alone, or table recognition can be used alone. Only the visualization effects of several representative usage methods are shown here.
3.1 Layout analysis and table recognition
The figure shows the pipeline of layout analysis + table recognition. The image is first divided into four areas of image, text, title and table by layout analysis, and then OCR detection and recognition is performed on the three areas of image, text and title, and the table is performed table recognition, where the image will also be stored for use.
3.2 Layout recovery
The following figure shows the effect of layout recovery based on the results of layout analysis and table recognition in the previous section.

3.3 KIE
- SER
Different colored boxes in the figure represent different categories.
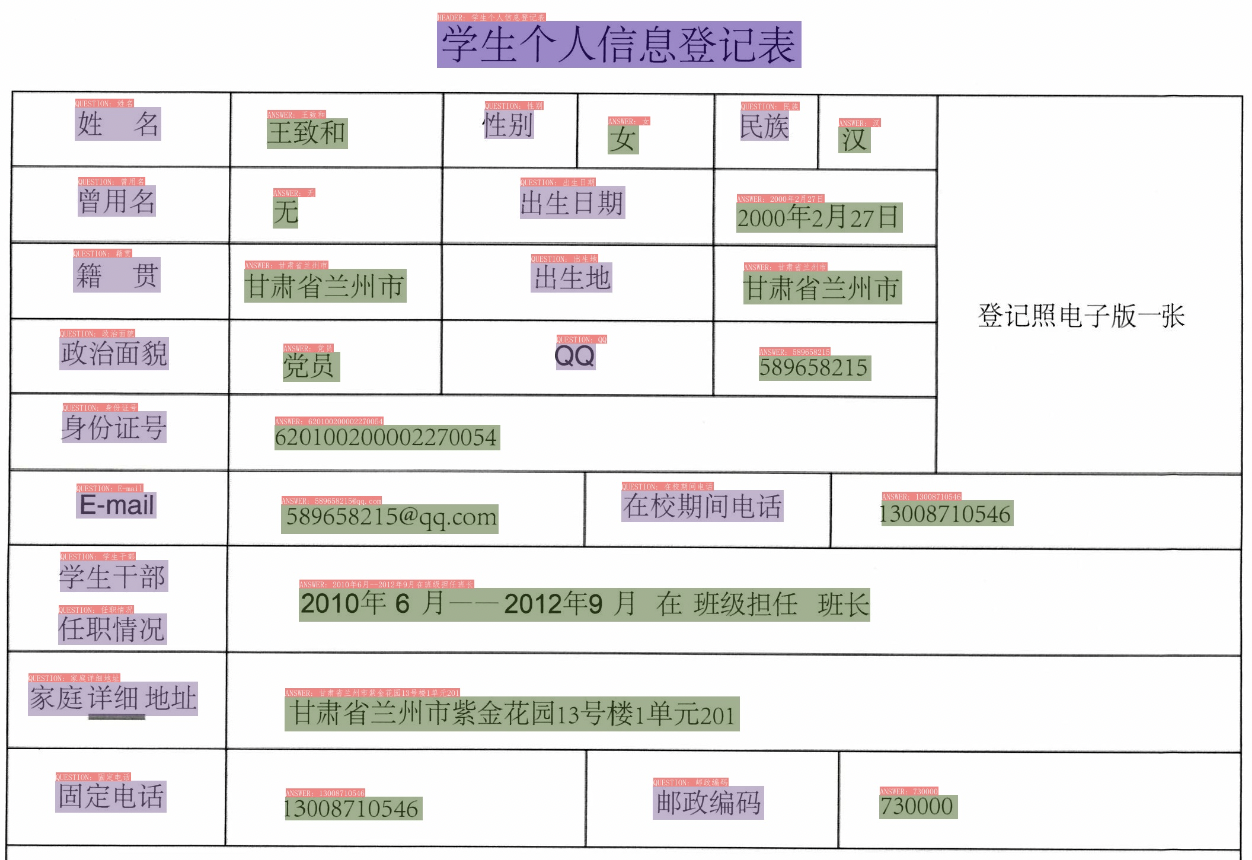
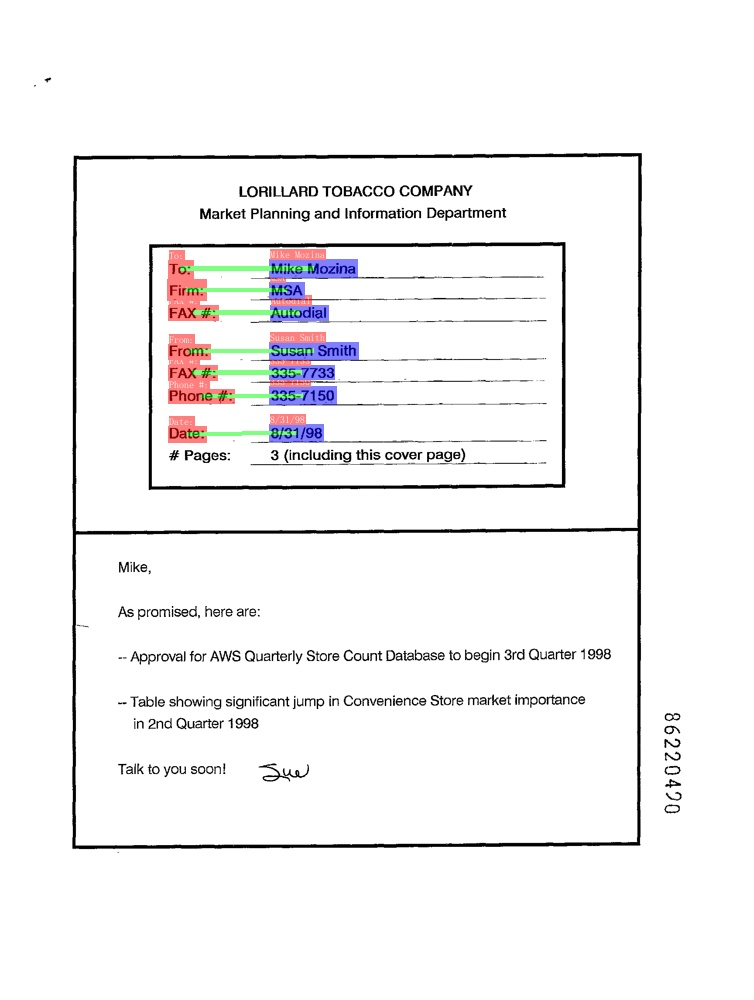
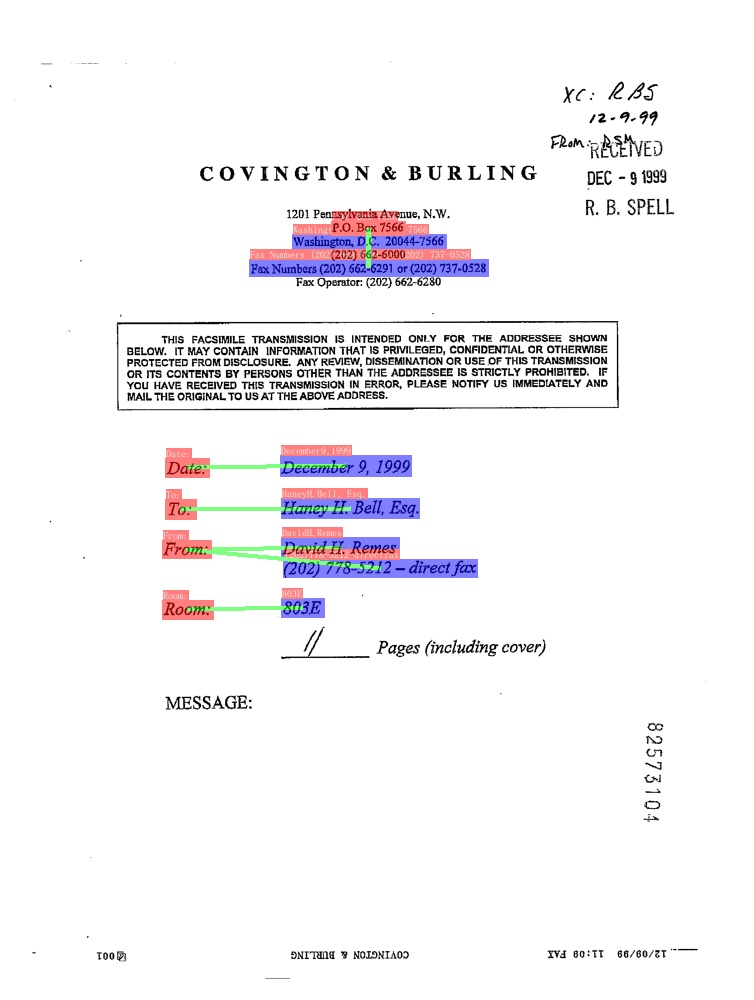
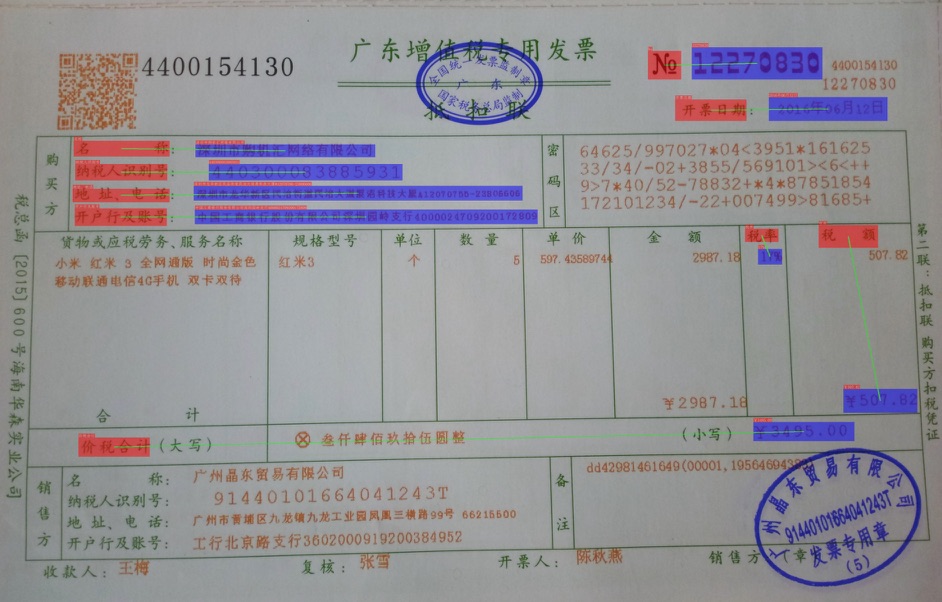
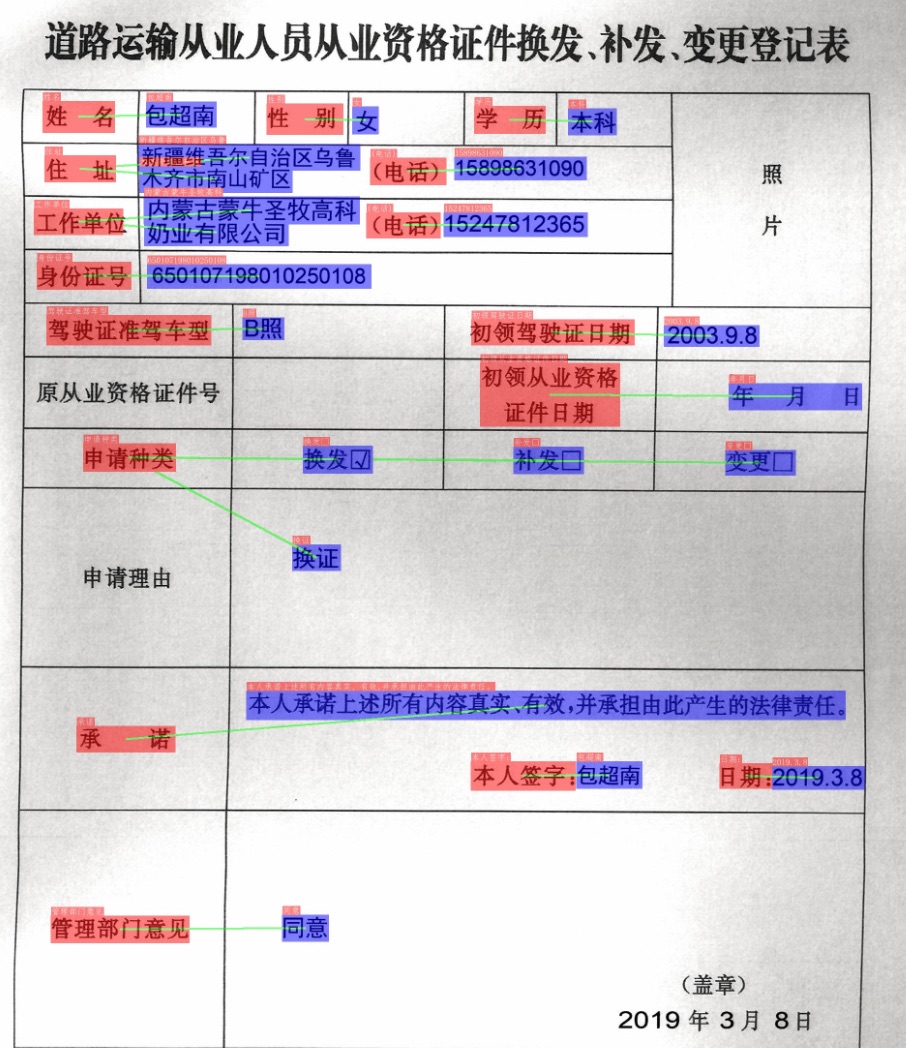
- RE
In the figure, the red box represents Question, the blue box represents Answer, and Question and Answer are connected by green lines.
4. Quick start
Start from Quick Start.
5. Model List
Some tasks need to use both the structured analysis models and the OCR models. For example, the table recognition task needs to use the table recognition model for structured analysis, and the OCR model to recognize the text in the table. Please select the appropriate models according to your specific needs.
For structural analysis related model downloads, please refer to:
For OCR related model downloads, please refer to:
